Gnuplot 绘图第三弹-颜色与样式
前两弹已经介绍了使用 Gnuplot 绘制图像的一些基本操作,在第三弹中我们将看到如何对 图像进行美化。
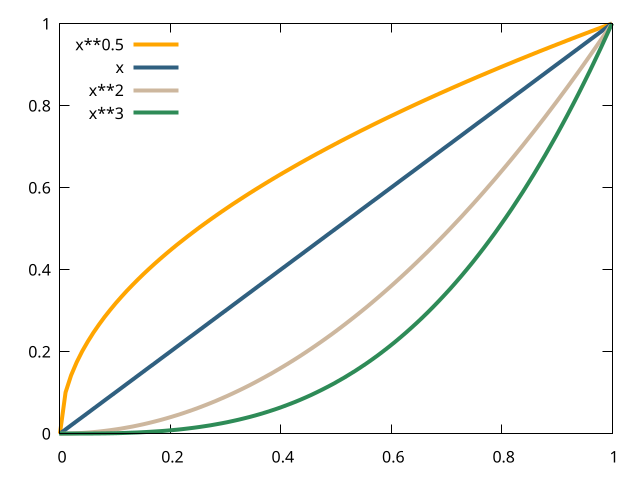
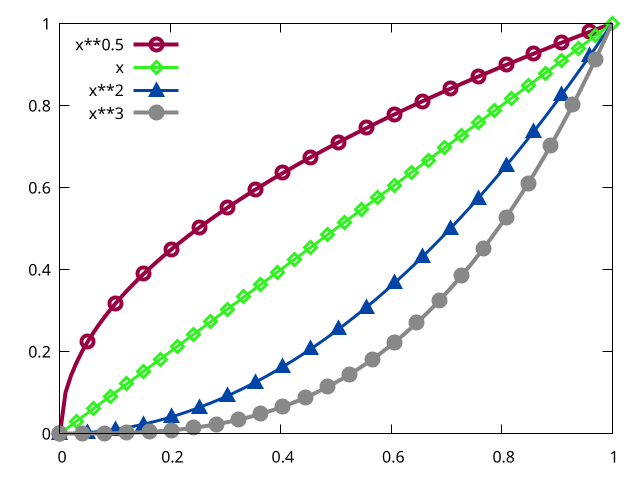
1. 设置曲线的颜色
# 设置全局的线宽,包括曲线、边框、刻度
set term pngcairo lw 4
# 将边框、刻度重新设置为 .25
set border lw .25
set key top left

# 使用 =show colors= 查看更多颜色,注意十六进制的颜色也要单引号
plot [0:1] x**0.5 lc rgb 'orange', x lc rgb 'steelblue',\
     x**2 lc rgb 'bisque', x**3  lc rgb '#2e8b57'
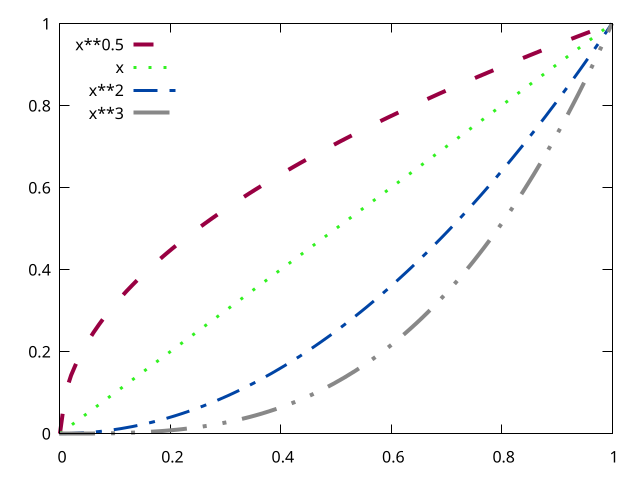
2. 自定义曲线的样式
# png 后端不支持显示 dash ,注意此处切换至 pngcairo
set term pngcairo
set key top left
set style line 1 dashtype 2 lw 4 lc rgb '#990042'
set style line 2 dashtype 3 lw 3 lc rgb '#31f120'
set style line 3 dashtype 4 lw 3 lc rgb '#0044a5'
set style line 4 dashtype 5 lw 4 lc rgb '#888888'

# 此时仍需手动指定曲线样式,要想自动指定,可设置 =set style increment userstyles=
# 系统会自动在用户设置的样式中循环,=set style increment default= 恢复默认
plot [0:1] x**0.5 ls 1, x ls 2, x**2 ls 3, x**3 ls 4
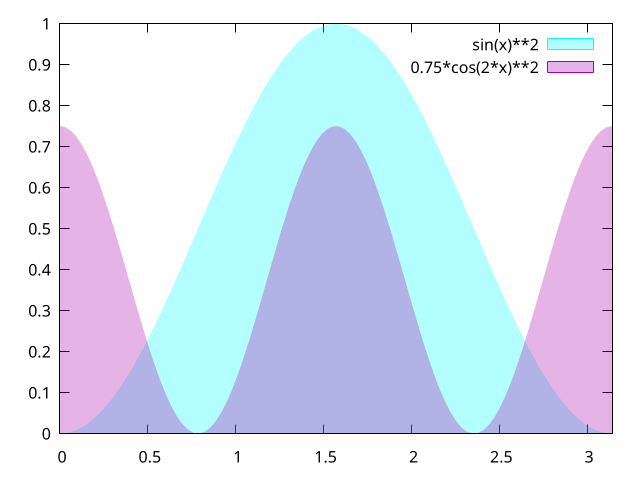
3. 透明的技术
set term pngcairo
# pattern 一样可以设置透明度 =style fill transparency pattern n= 其中 n 是
# pattern 的序号,这里的透明指的是 pattern 中间的镂空部分可以看到后面
set style fill transparent solid 0.3

plot [0:pi] sin(x)**2 with filledcurves above y1=0 lc rgb  '#00ffff',\
     0.75*cos(2*x)**2 with filledcurves above y1=0 lc rgb '#aa00aa'
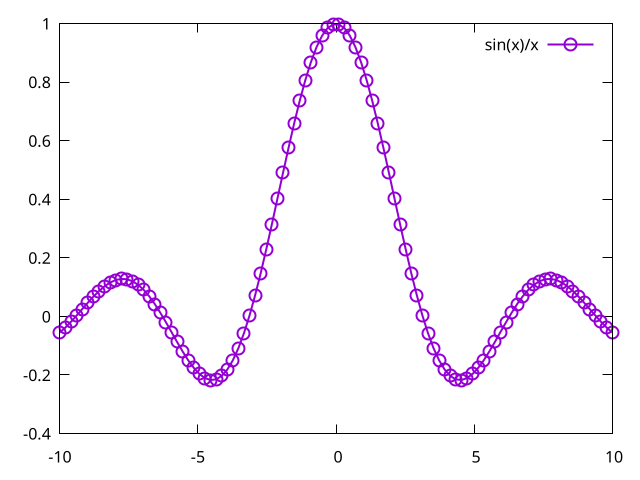
4. 带点的线
plot sin(x)/x with linespoints pointsize 2 pointtype 6 lw 2
5. 定制点的样式
set key top left

# 此行告诉 Gnuplot 我要设置的是 linespoints 的样式而不是 lines 的样式
set style function linespoints
# 此处 pi 是指 pointinterval,指多少个采样点放置一个 Marker
set style line 1 lw 4 lc rgb '#990042' ps 2 pt 6 pi 5
set style line 2 lw 3 lc rgb '#31f120' ps 2 pt 12 pi 3
set style line 3 lw 3 lc rgb '#0044a5' ps 2 pt 9 pi 5
set style line 4 lw 4 lc rgb '#888888' ps 2 pt 7 pi 4

plot [0:1] x**0.5 ls 1, x ls 2, x**2 ls 3, x**3 ls 4
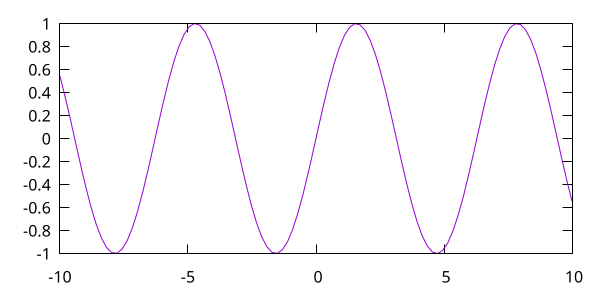
6. 改变图像的大小
# 此处的 size 对于 eps 等矢量图来说绝对尺寸并没有意义,只是表示长宽比,设为 6,3
# 也是一样的效果,但是对于 png 来说只能设置绝对尺寸
set term pngcairo size 600,300
set key off
plot sin(x)
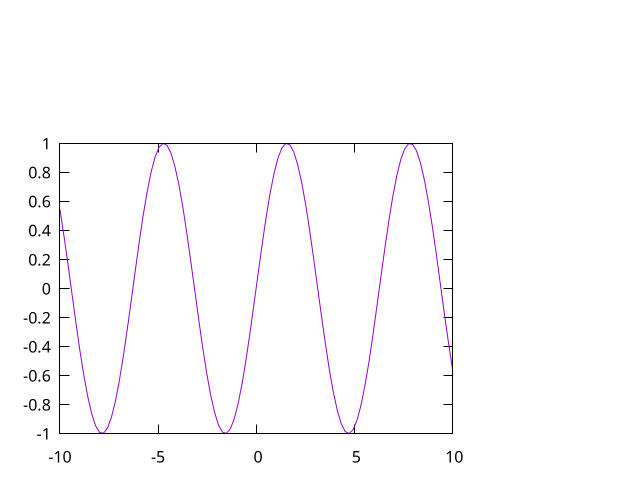
7. 改变 Axes 的大小
set key off
set size .75,.75
plot sin(x)
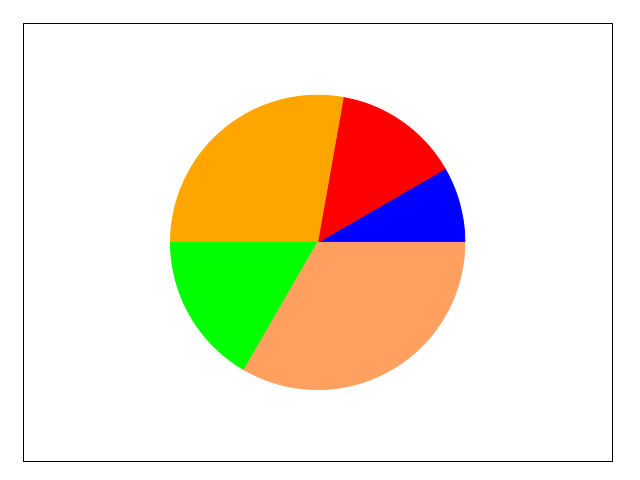
8. 绘制对象
unset key
unset tics
set object 1 circle at graph .5,.5 size graph .25 fillcolor rgb 'blue'\
    fillstyle solid arc [0:30] front
set object 2 circle at graph .5,.5 size graph .25 fillcolor rgb 'red'\
    fillstyle solid arc [30:80] front
set object 3 circle at graph .5,.5 size graph .25 fillcolor rgb 'orange'\
    fillstyle solid arc [80:180] front
set object 4 circle at graph .5,.5 size graph .25 fillcolor rgb 'green'\
    fillstyle solid arc [180:240] front
set object 5 circle at graph .5,.5 size graph .25 fillcolor rgb 'sandybrown'\
    fillstyle solid arc [240:360] front

plot [0:1][0:1] -1