Gnuplot 绘图第八弹-3D 绘图
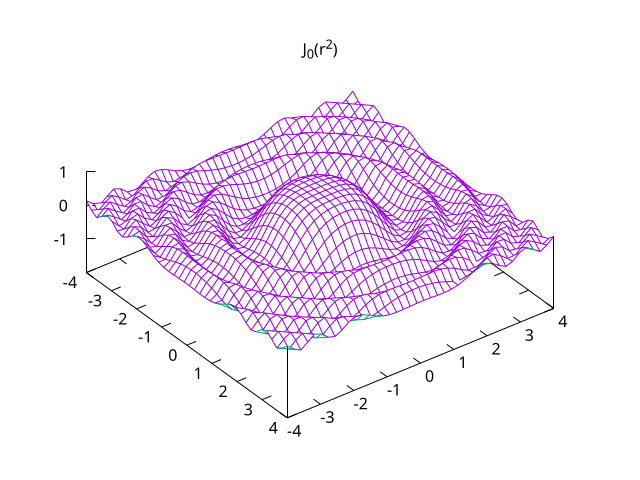
1. 绘制表面
# 网格的采样数
set isosamples 40
unset key
# 隐藏被网格遮挡的元素
set hidden3d
set title "J_0(r^2)"
set xrange [-4:4]
set yrange [-4:4]
set ztics 1

# 视角角度
set view 29,53
splot besj0(x**2 + y**2)
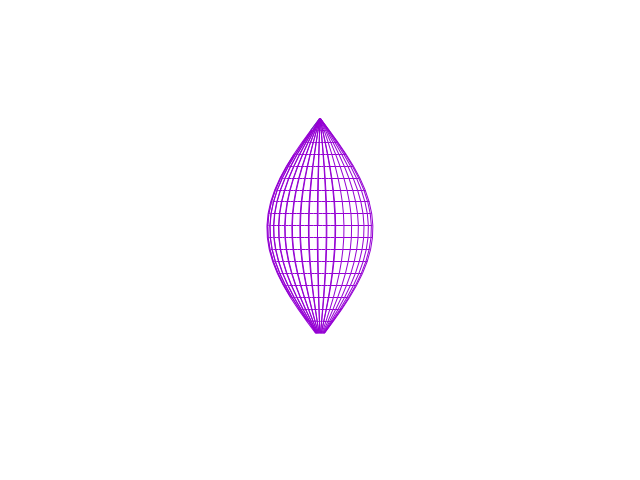
2. 坐标映射
# 将数据解释为圆柱形坐标系
set mapping cylindrical
set hidden
unset border
unset tics
set xrange [-pi:pi]
set yrange [-pi:pi]
set zrange [0:pi]
set iso 60
unset key
set view 90,0

splot '++' using 1:2:(sin($2)) with lines
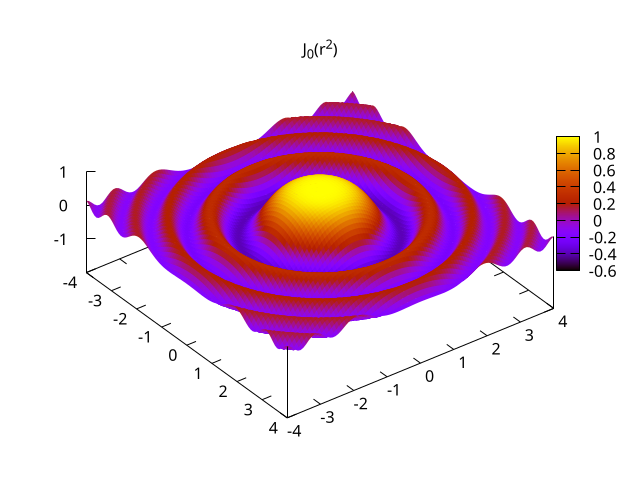
3. 给表面上色
set iso 100
set samples 100
unset key
set title "J_0(r^2)"
set xrange [-4:4]
set yrange [-4:4]
set ztics 1
unset surface
set pm3d
set view 29,53
splot besj0(x**2 + y**2)
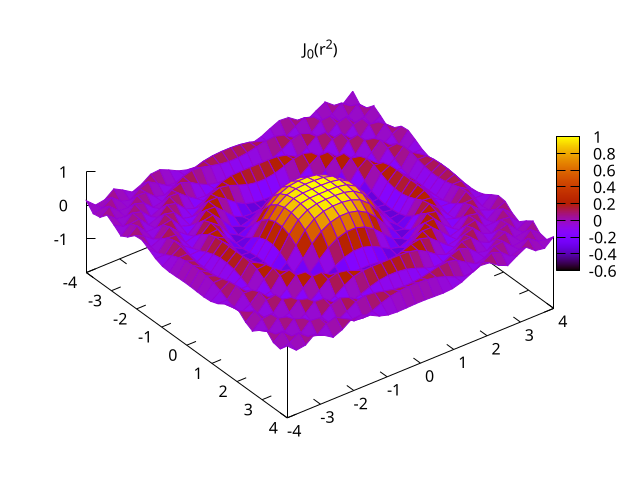
set iso 30
set samples 30
unset key
set title "J_0(r^2)"
set xrange [-4:4]
set yrange [-4:4]
set ztics 1
unset surface
set style line 1 lt 4 lw .5
set pm3d at s hidden3d 1
set view 29,53
splot besj0(x**2 + y**2)
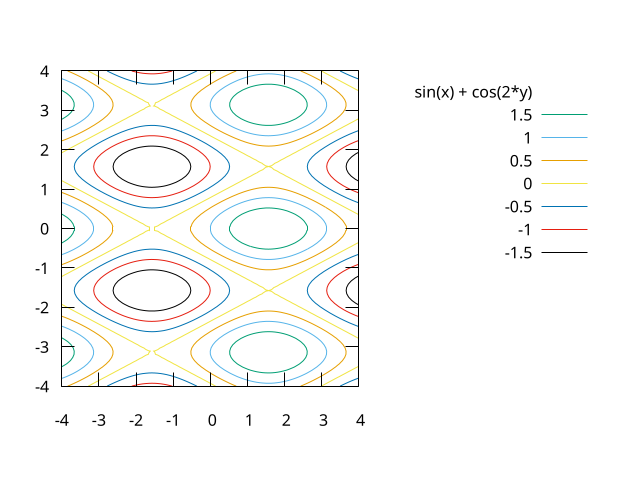
4. 等高线图
# 设置等高线的数量
set cntrparam levels 10
# 告诉 Gnuplot 绘制等高线图,并且绘制在 x-y 面上
set contour base
unset sur
# 从正上方看下来
set view map
set xrange [-4:4]
set yrange [-4:4]
set iso 100
set samp 100
set key rmargin
splot sin(x) + cos(2*y)
# 设置等高线的数量
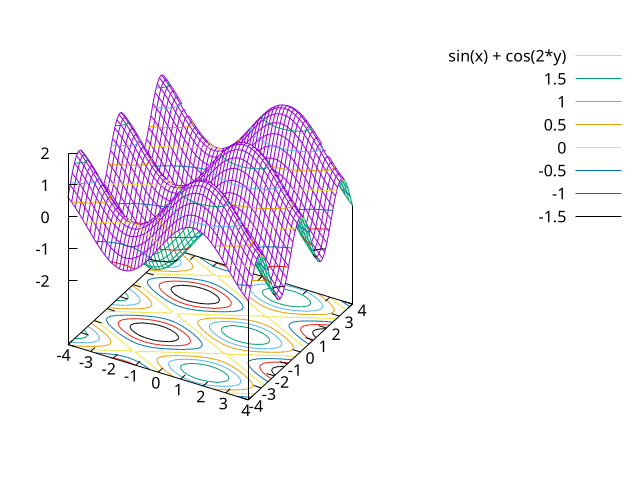
set cntrparam levels 10
# 告诉 Gnuplot 绘制等高线图和表面
set contour both
set xrange [-4:4]
set yrange [-4:4]
set ztics 1
set iso 50
set samp 50
set hidden3d
set key rmargin
set style line 1 lc rgb '#cccccc'
set view 60, 30
splot sin(x) + cos(2*y) with lines ls 1
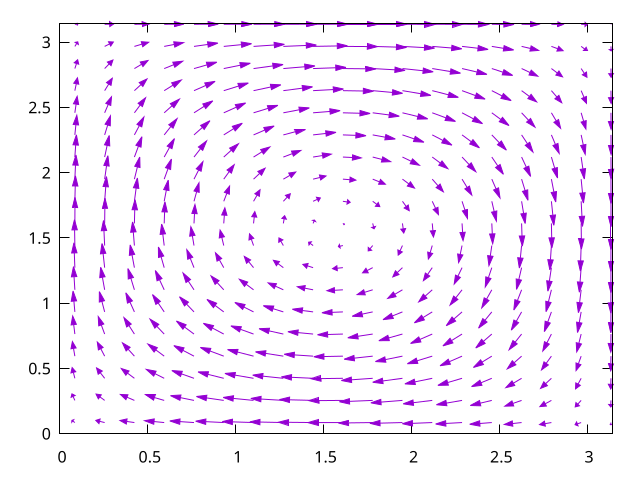
5. 矢量图
set xrange [0:pi]
set yrange [0:pi]
set iso 60
set samp 60
unset key
a = .2
plot '++' using 1:2:(-a*sin($1)*cos($2)):(a*cos($1)*sin($2))\
     with vec size .06, 15 filled
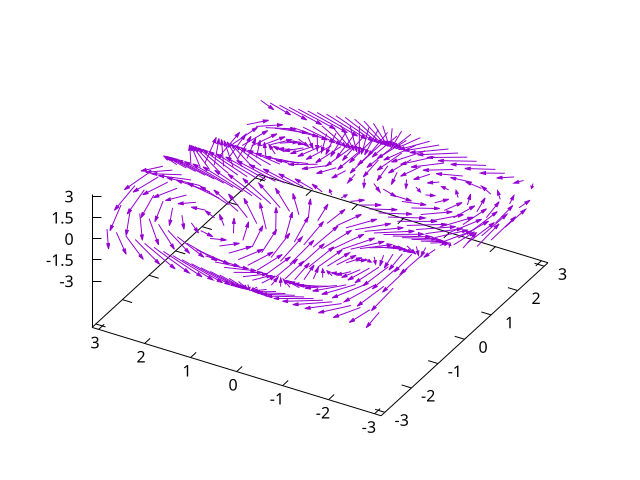
set xrange [-pi:pi]
set yrange [-pi:pi]
set zrange [-pi:pi]
unset key
set iso 50
set samp 20
set ztics 1.5
set view 37, 300
a = .9
splot '++' using 1:2:(2*a*cos($2)*sin($1)):\
      (-a*sin($1)*cos($2)):(a*cos($1)*sin($2)):(a*cos($1))\
      with vec size .06, 15 filled
6. 热力图
set xrange [-4:4]
set yrange [-4:4]
set iso 100
set samp 100
unset key
unset surface
set view map
set pm3d at b
splot sin(y**2 + x**2) - cos(x**2)

set palette defined (0 'black', 1 'gold')
replot
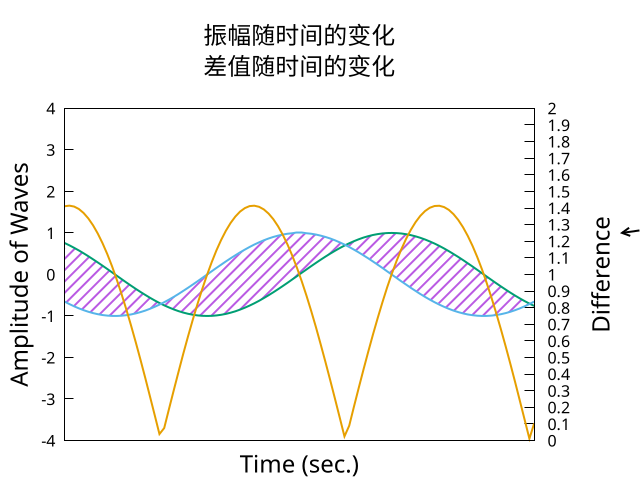
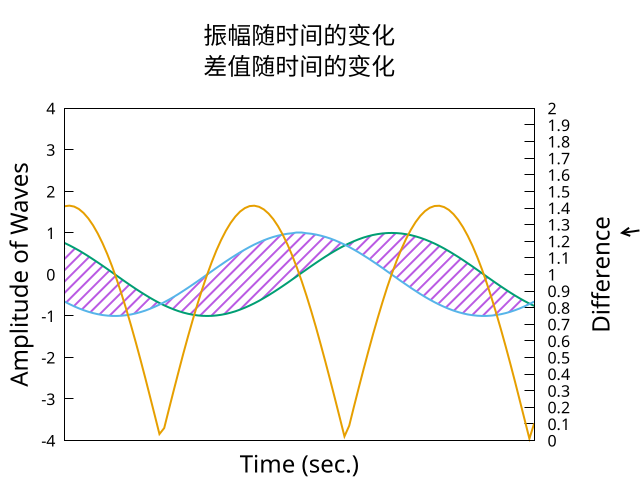
set palette defined (0 'black', 1 'aquamarine', 1.5 'red', 2 'gold')
replot
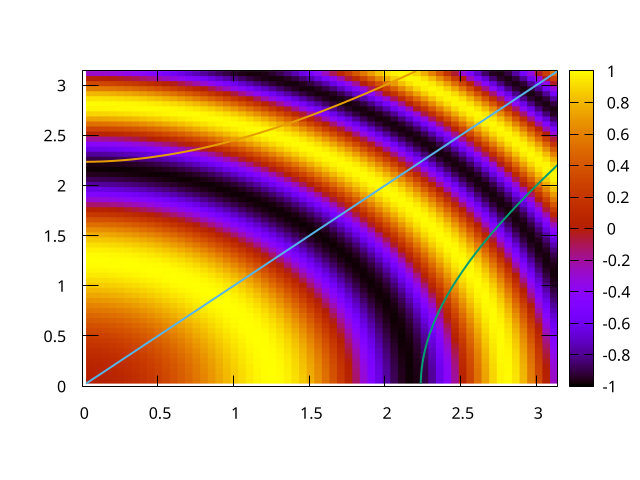
7. 同时绘制热力图和等高线图
set xrange [0:pi]
set yrange [0:pi]
set iso 200
set samp 200
set cntrparam levels 10
unset key
unset surface
set view map
set contour base
set pm3d at b

# 此处有四列数据,因为我们在上面告诉 Gnuplot 要画等高线图,等 4 列数据是可选的,
# 用于给 surface 上色
splot '++' using 1:2:($1**2-$2**2):(sin($1**2+$2**2)) w l lw 2
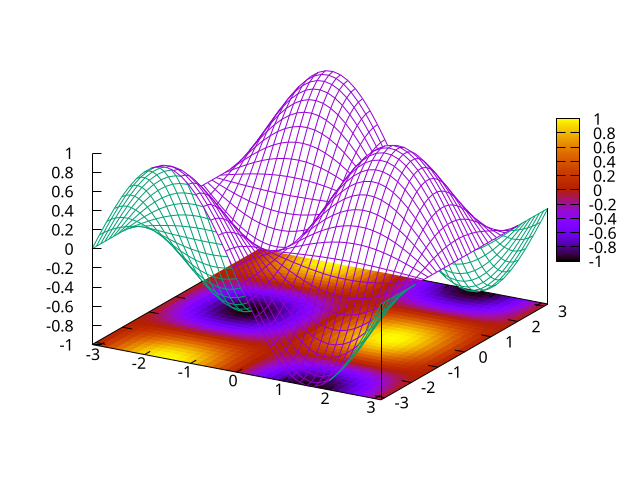
8. 同时绘制热力图和表面
set iso 40
set samp 40
unset key
set xrange [-pi:pi]
set yrange [-pi:pi]
f(x,y) = sin(x)*cos(y)
# 这一行使 surface 绘制出遮挡关系的同时,在最后才绘制 surface,否则会被下面的热
# 图盖住
set hidden front
# 将 xy 平面移动到 -1 处
set xyplane at -1

splot f(x,y) with pm3d at b, f(x,y) with lines
reset
set samp 40
set iso 40
set yrange [-1.5:1.5]
set xrange [-1.5:1.5]
unset ytics
unset xtics
unset key
unset colorbox
set hidden3d front
a = .5
set xyplane at a
f(x,y) = exp(-x**2-y**2)

splot f(x,y) with pm3d at b, f(x,y) with lines, a with lines lt -100
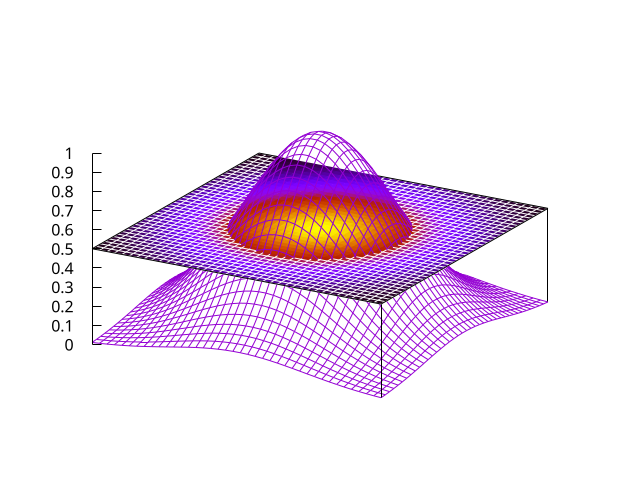
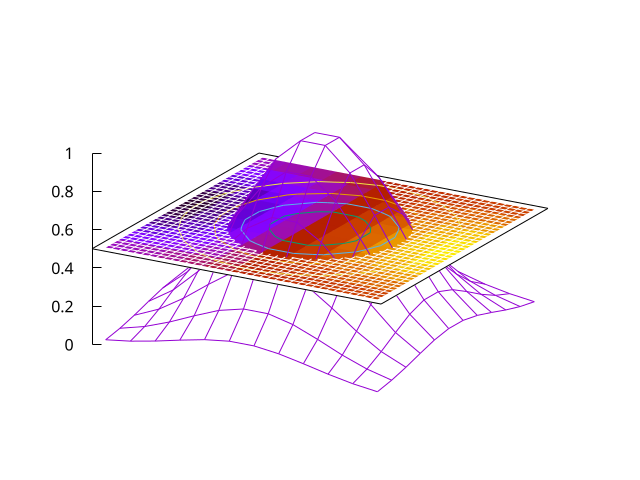
set zrange [0:1]
set contour base

splot '++' using 1:2:(a):(sin($1)*cos($2)) with pm3d at b,\
      '++' using 1:2:(f($1,$2)) with lines, a with lines lt -100
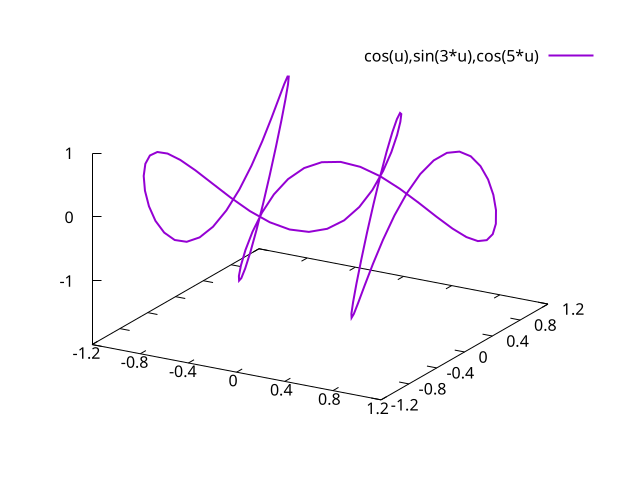
9. 使用参数方程绘制路径
set samp 100
set xtics .4
set ytics .4
set parametric
set urange [-pi:pi]
set ztics 1

splot cos(u),sin(3*u),cos(5*u) lw 2
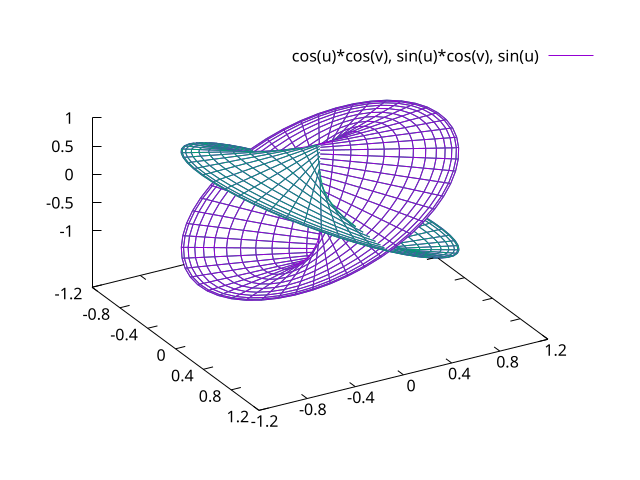
10. 使用参数方程绘制表面
set param
set iso 50
set ztics .5
set xtics .4
set ytics .4
set urange [-pi:pi]
set vrange [-pi:pi]
set hidd
set view 50, 60

 splot cos(u)*cos(v), sin(u)*cos(v), sin(u)
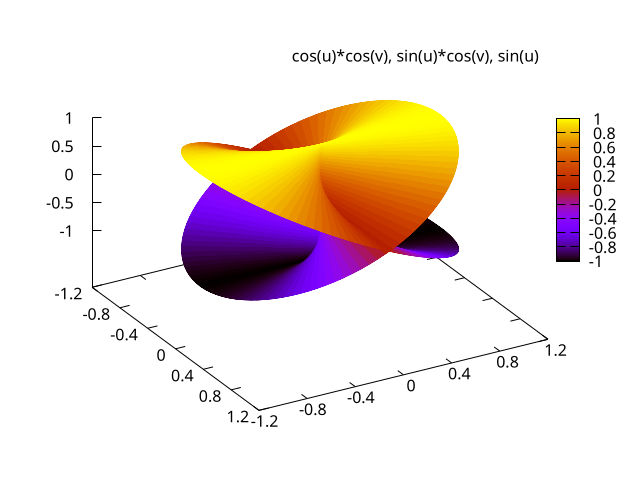
甚至我们还能给表面上色
set param
set iso 50
set ztics .5
set xtics .4
set ytics .4
set urange [-pi:pi]
set vrange [-pi:pi]
set view 50, 60
# depthorder 是 pm3d 的一个特殊选项,会按离观察点的远近渲染颜色
set pm3d depthorder

splot cos(u)*cos(v), sin(u)*cos(v), sin(u) with pm3d
 本站文章如未特殊声明,默认采用