Gnuplot 绘图第一弹-二维数据绘图
Gnuplot is a portable command-line driven graphing utility for Linux, OS/2, MS Windows, OSX, VMS, and many other platforms. The source code is copyrighted but freely distributed (i.e., you don't have to pay for it). It was originally created to allow scientists and students to visualize mathematical functions and data interactively, but has grown to support many non-interactive uses such as web scripting. It is also used as a plotting engine by third-party applications like Octave. Gnuplot has been supported and under active development since 1986.
1. 调色板
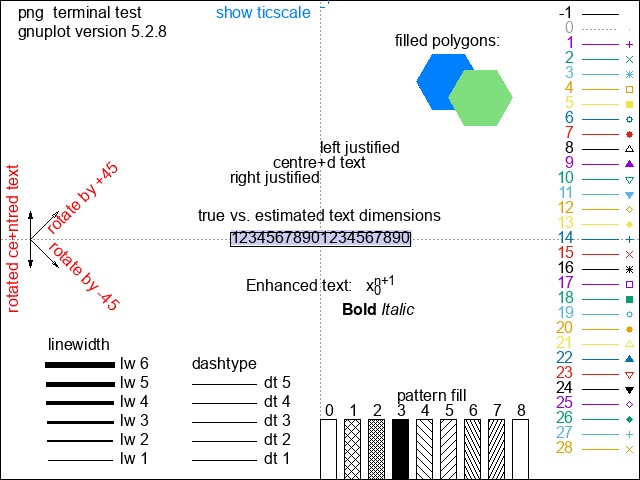
在 Gnuplot 的交互式命令行中使用 test 命令可以调出调色板,查看 Gnuplot 支持的样式
与配色。
test

注意: 不同的后端支持的颜色和样式是不同的,同时同一个序号所代表的样式也很可能是不
同的。下面这张图是由 png 后端生成的,注意与上面由 pngcairo 后端生成的样式的区别。
不同的后端绘制效果可能会有很大差别,在使用时一定要注意自己所使用的后端。对比可以
发现,pngcairo 后端支持透明和 dash。对于交互式命令行,可以使用 test 命令查看后端
信息。对于 Org babel 环境,可以用 M-x customize-group org-babel 设置 Org Babel
Gnuplot Term 变量为 pngcairo 来得更好的绘制效果。
set term png
test
2. Hello World
reset
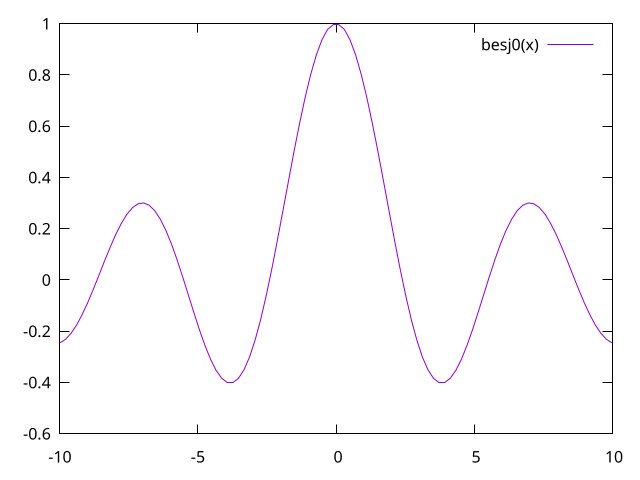
plot besj0(x)
3. 绘制曲线的同时指定坐标范围
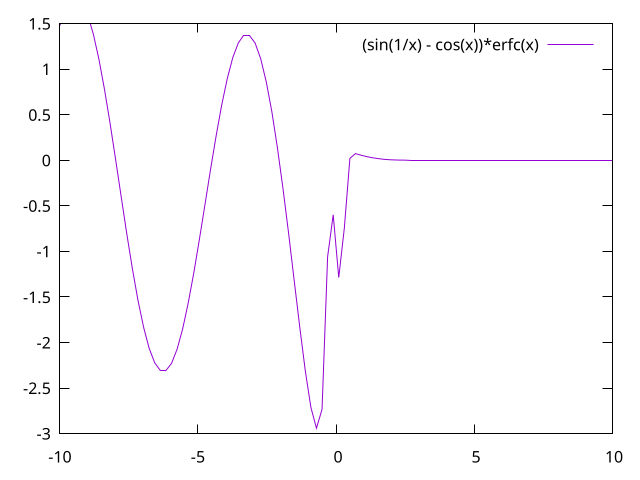
plot [][-3:1.5] (sin(1/x) - cos(x))*erfc(x)
将函数的数据写入到文件
set table 'f1.dat'
plot [-5:5] (sin(1/x) - cos(x))*erfc(x)
unset table
绘制多条曲线
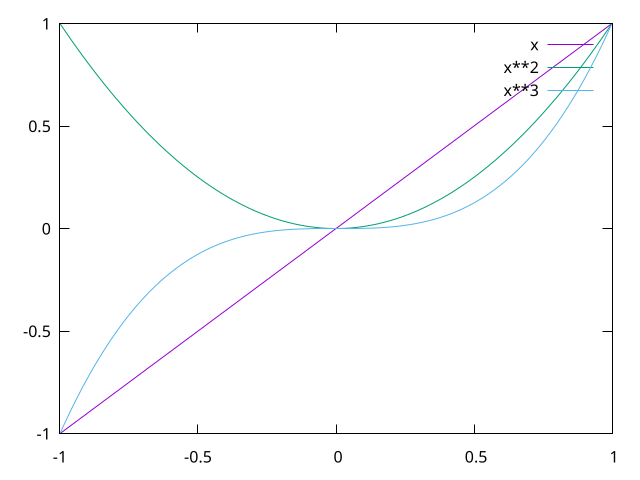
plot [-1:1] x, x**2, x**3
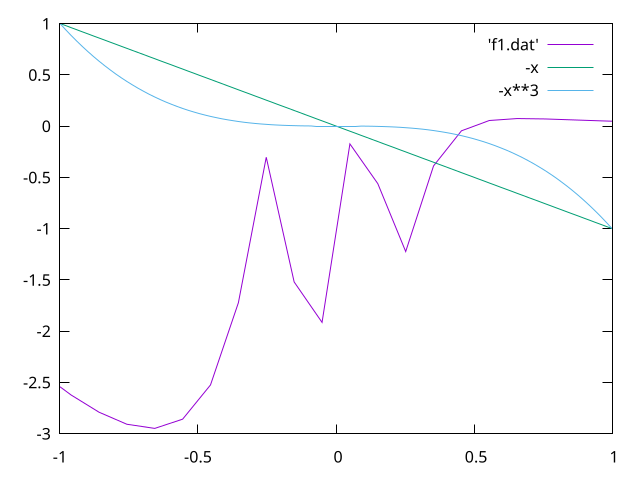
使用文件中的数据进行绘制
plot [-1:1] 'f1.dat' with lines lw 1, -x, -x**3
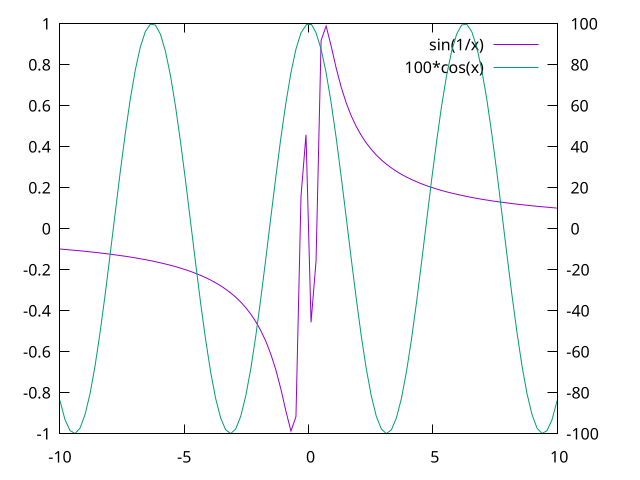
绘制双 y 轴图, set y2tics start, sep 设置 y2 轴的起始值以及间隔
set y2tics -100, 20
set ytics nomirror
plot sin(1/x) axis x1y1,100*cos(x) axis x1y2
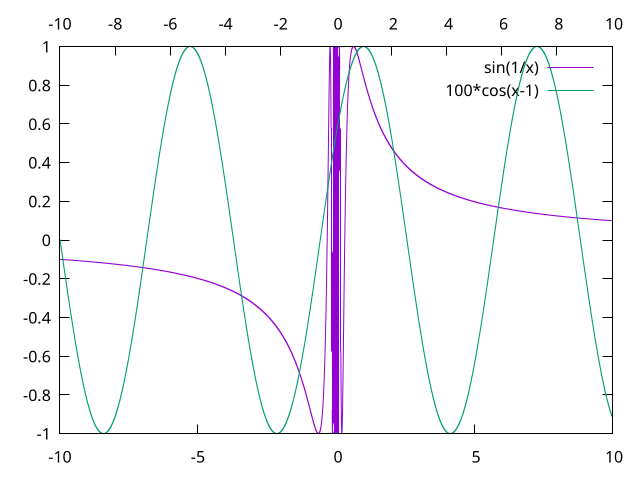
设定采样数
reset
set sample 100000
set x2tics -20, 2
set xtics nomirror
plot sin(1/x) axis x1y1, 100*cos(x-1) axis x2y2
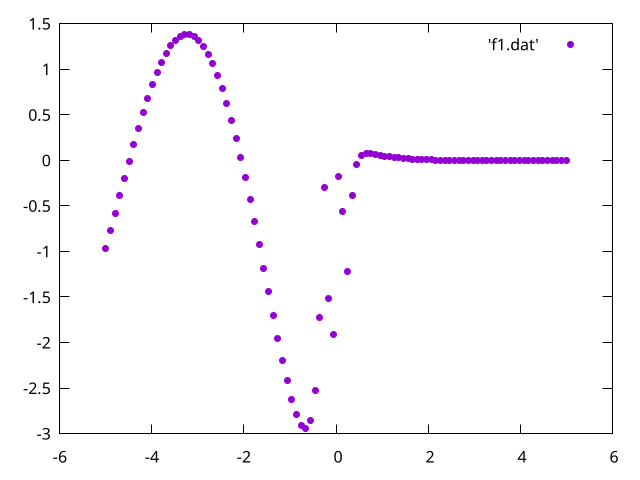
绘制散点图
reset
plot 'f1.dat' with points pt 7
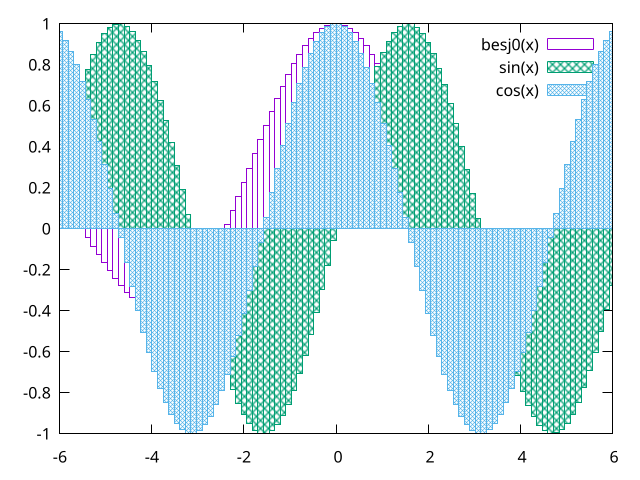
绘制盒形图,其中 set style 有以下几种取值
set style fill empty不进行填充set style fill pattern填充图案set style fill solid填充颜色
reset
set style fill pattern
plot [-6:6]  besj0(x) with boxes, sin(x) with boxes, cos(x) with boxes
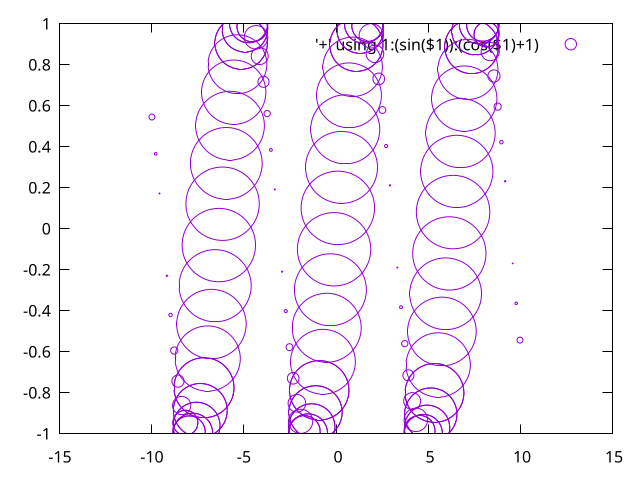
绘制圆圈图,圆圈图需要 3 列数据, x:y:r
reset
plot '+' using 1:(sin($1)):(cos($1)+1) with circles
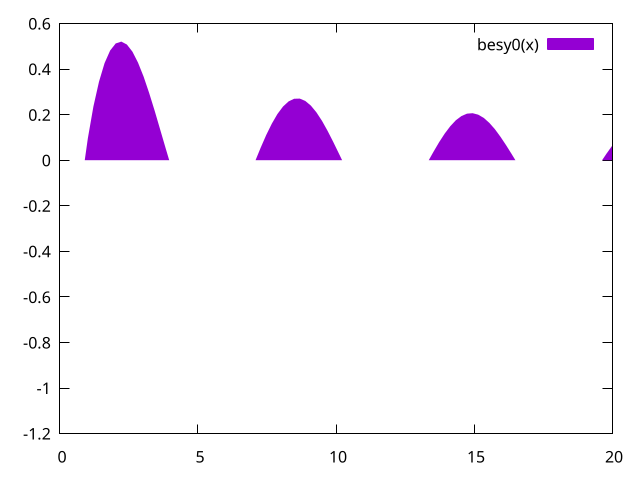
填充曲线
reset
set style fill solid
plot [0:20] besy0(x) with filledcurves above y1=0
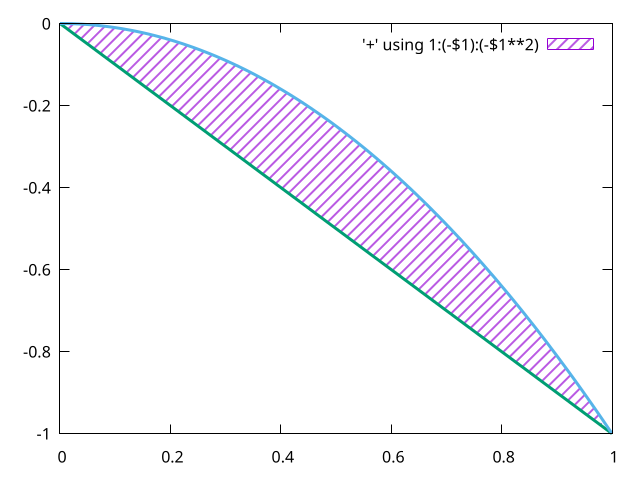
曲线填充也不用真实的文件,这里的 + 表示一个虚拟文件,其中的第一列是由 Gnuplot 自
动生成的 x 采样值
reset
set style fill pattern 5
plot [0:1] '+' using 1:(-$1):(-$1**2) with filledcurves, -x lw 3 notitle, -x**2 lw 3 notitle
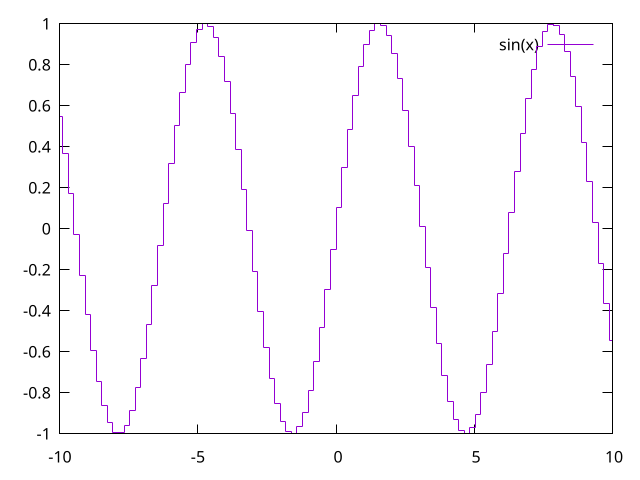
以直方图的形式绘制曲线
reset
plot [-10:10] sin(x) with histeps
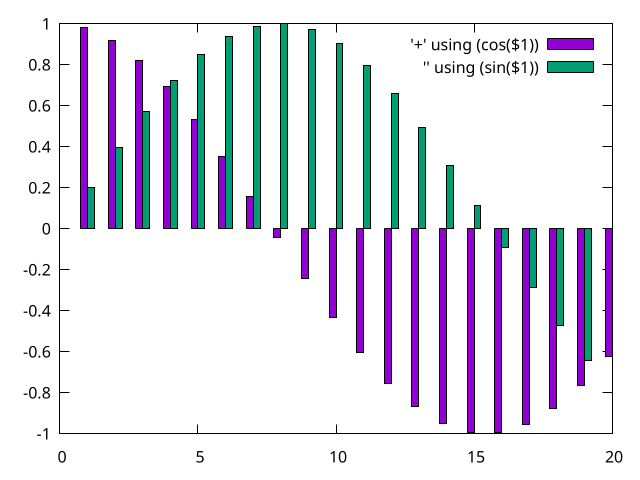
并排的直方图
reset
set style fill solid 1.0 border lt -1
set style data histograms
plot [0:20] '+' using (cos($1)), '' using (sin($1))
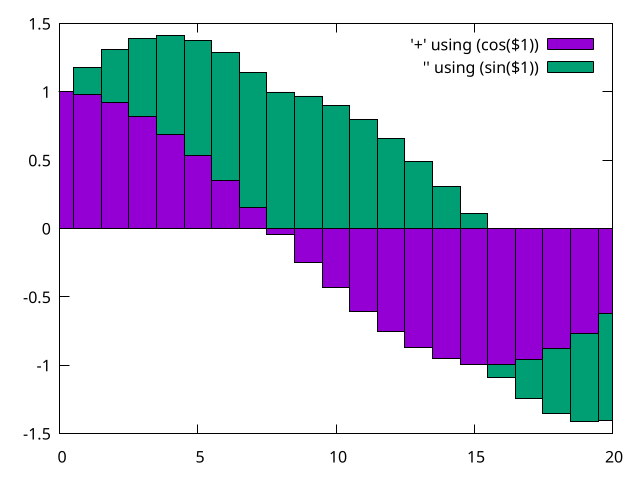
叠加的直方图
reset
set style fill solid 1.0 border lt -1
set style data histograms
# 數據會按行進行累加,如果沒有這行,默認是多組數據並排
set style histogram rowstacked
plot [0:20] '+' using (cos($1)), '' using (sin($1))
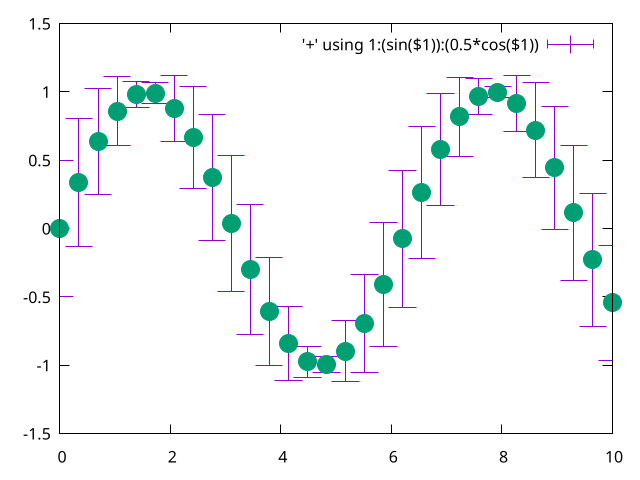
绘制带误差条的点图
reset
set sample 30
set pointsize 3
# errorbar 的宽度
set bars 3
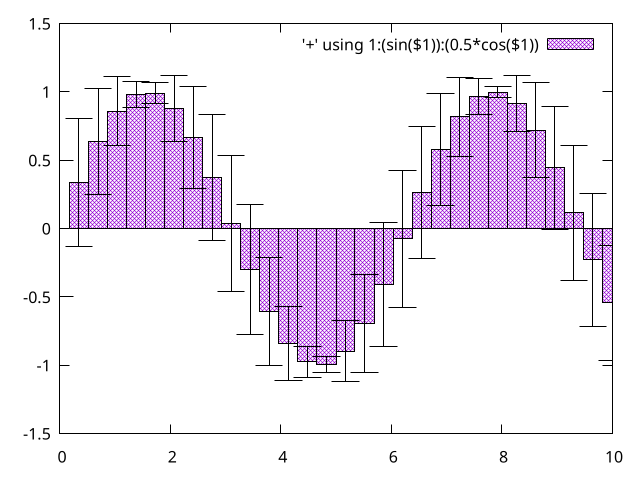
plot [0:10] '+' using 1:(sin($1)):(0.5*cos($1)) with errorbars,\
     '' using 1:(sin($1)) pt 7 notitle
reset
set sample 30
set bars 3
set style fill pattern 2 border lt -1
plot [0:10] '+' using 1:(sin($1)):(0.5*cos($1)) with boxerrorbars
棒状图
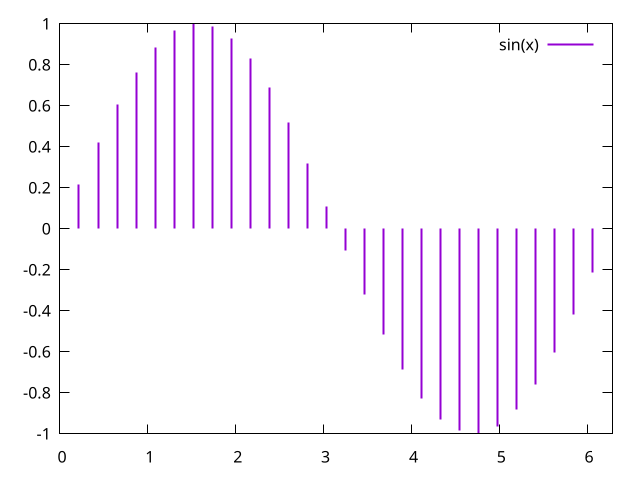
set samples 30
plot [0:2*pi] sin(x) with impulses lw 2
绘制参数方程曲线
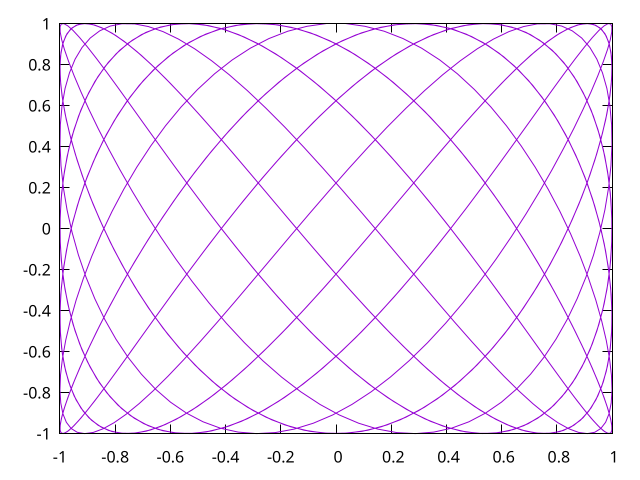
set samples 1000
set parametric
plot sin(7*t), cos(11*t) notitle
极坐标绘图
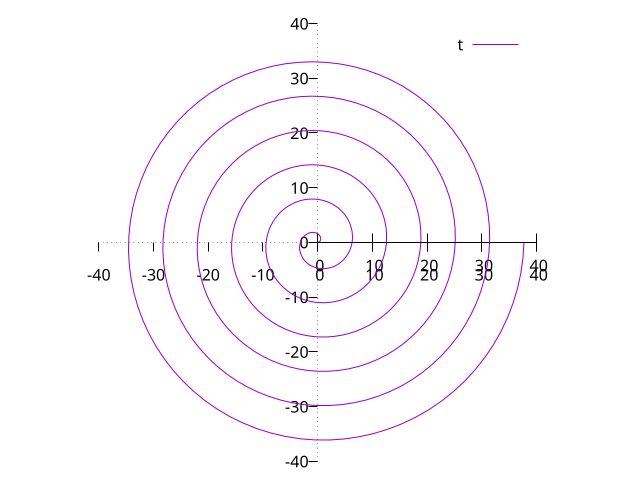
reset
set size ratio 1
set xtics axis nomirror
set ytics axis nomirror
set zeroaxis
unset border
set samples 500
set polar
plot [0:12*pi] t
 本站文章如未特殊声明,默认采用