Gnuplot 绘图第七弹-Gnuplot 式编程与数据处理
目前为此,所有绘图相关的操作都已经介绍完毕,接下来来点高级的。
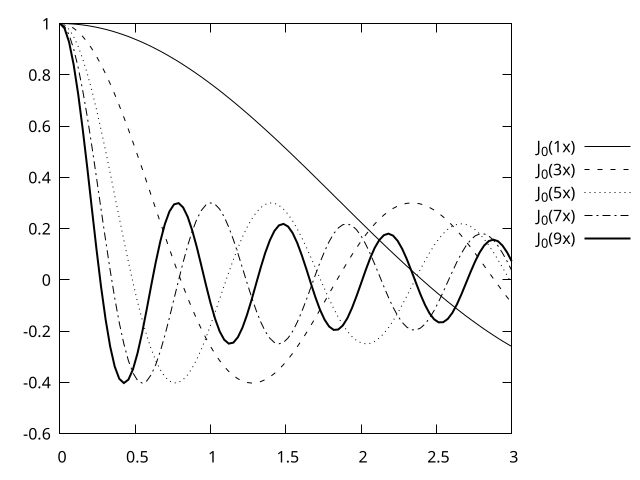
1. for 循环
set term pngcairo mono dashed enhanced
set rmargin at screen .8
set key right center at screen 1,.6
plot [0:3] for [n=1:10:2] besj0(n*x) title "J_0(".n."x)"

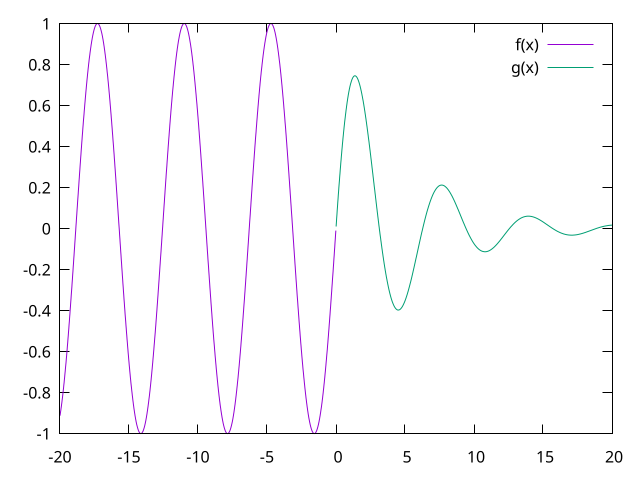
2. a:b:c 三目运算符
set samples 2000
f(x) = x < 0? sin(x) : NaN
g(x) = x >= 0? exp(-x/5.)*sin(x) : NaN
plot [-20:20] f(x), g(x)

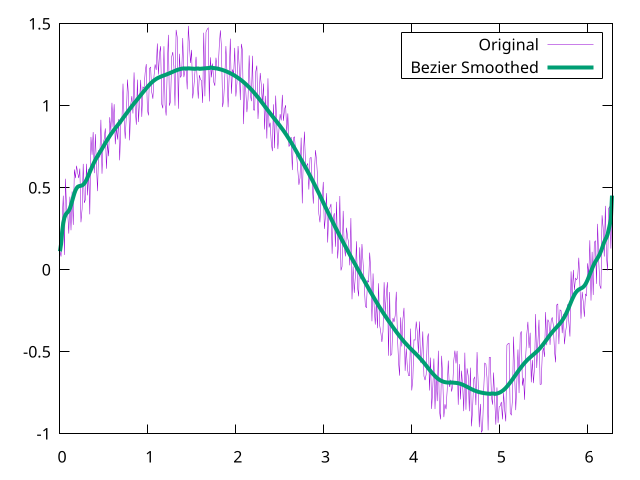
3. 平滑曲线
set samples 500
set key right top box
set xrange [0:2*pi]

set table '~/random.dat'
plot sin(x) + 0.5 * rand(0)
unset table

plot '~/random.dat' w l lw 0.5 title "Original",\
     '' smooth bezier lw 4 title "Bezier Smoothed"

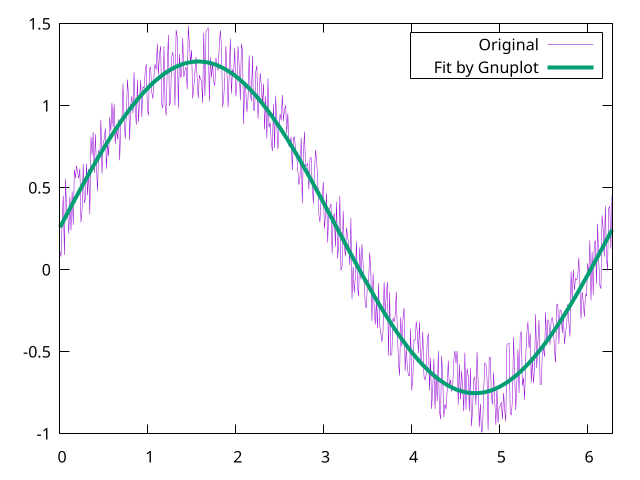
4. 拟合曲线
set key right top box
set xrange [0:2*pi]

f(x) = a * sin(b * x) + c
fit f(x) '~/random.dat' via a, b, c

plot '~/random.dat' w l lw 0.5 title "Original",\
     f(x) w l lw 4 title "Fit by Gnuplot"

 本站文章如未特殊声明,默认采用