Gnuplot 绘图第二弹-标签与图例
上一弹中介绍了 Gnuplot 能够绘制的 2D 图形,这一弹接着来介绍一下 Gnuplot 中的标签 与图例。
设置标签
set xrange [0:4*pi]
set yrange [-1.2:2]
set y2range [0:2]
set ytics nomirror
set y2tics 0, .1
set style fill pattern 5
set xlabel "Time (sec.)"
set ylabel "Amplitude of Waves"
set y2label "Difference"
# 文本需要手动换行
set title "Amplitude with time\nAnd Difference between waves"

# 绘制每一条线的 title 用来设定图例文本
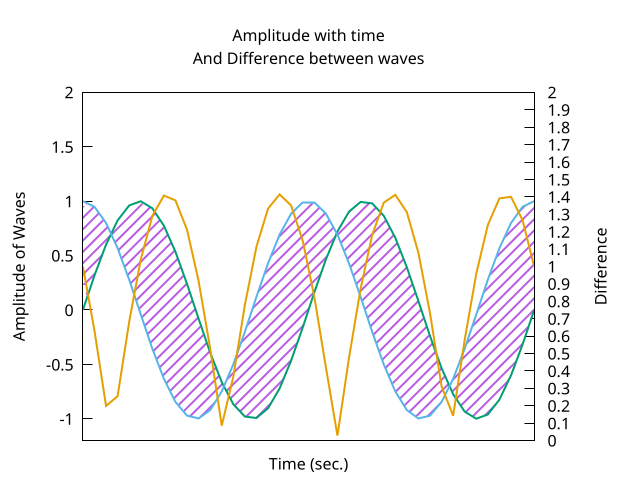
plot '+' using 1:(sin($1)):(cos($1)) with filledcurves notitle,\
     sin(x) w l lw 2,\
     cos(x) w l lw 2,\
     '' using 1:(abs(sin($1)-cos($1))) w l lw 2 axis x1y2 title "Difference"
改变标签字体大小
# 全局字体
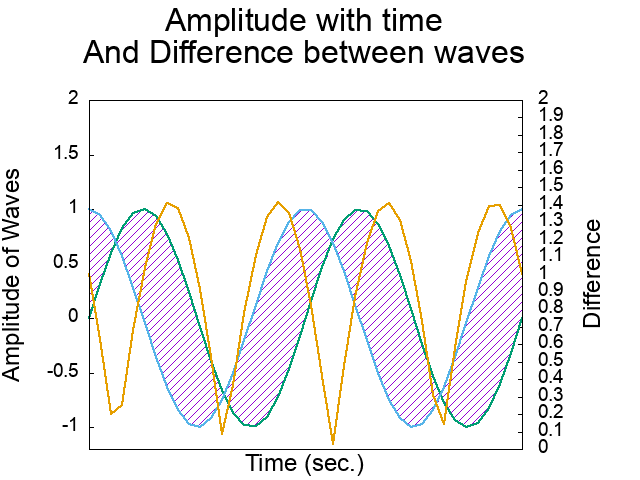
set term png font 'Arial, 14'

# 单独设置某一部分的字体大小
set xlabel font ",18"
set ylabel font ",18"
set y2label font ",18"
# 同时设置内容和大小
set title "Amplitude with time\nAnd Difference between waves" font ",24"

replot
设置图例的位置和字体等属性
  # spacing 调整图例之间的间距,默认值是 1.25
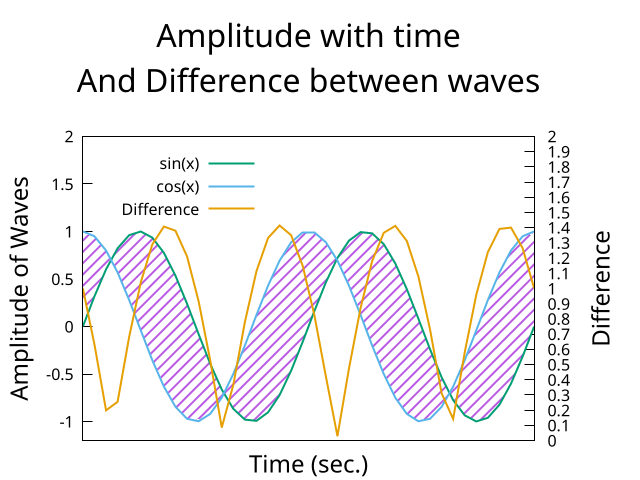
  set key at graph .4, .95 spacing 1

replot
图例显示在图外面
set term png size 500,200
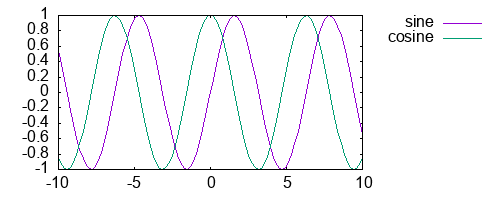
set key outside

plot sin(x) title "sine", cos(x) title "cosine"
set key box lt -1 lw 2

replot
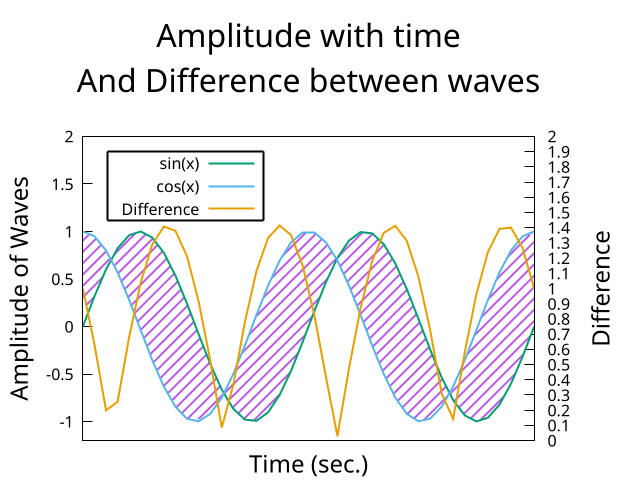
带箭头的文本
# left at 后面的数字是 x1y1 坐标轴,offset 后面是以字体网格为坐标
set label "Max Difference" left at 8, 1.5 offset .5, 0
# arrow 后面的 1 是一个 tag,front 是告诉 gnuplot 在最前面绘制 arrow
# size 中的第一个数字是箭头倒钩的长度,第二个数字是倒钩的角度
set arrow 1 from first 8, 1.5 to pi*7/4, 1 lt -1 lw 2 front size .3, 15

replot
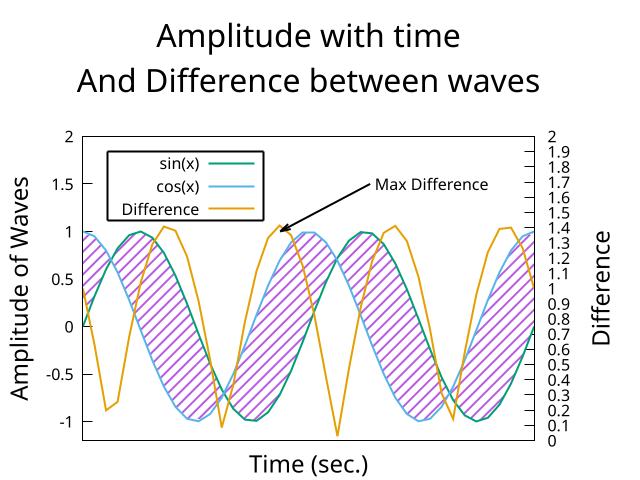
在标签和标题中使用 Unicod 字符,需要注意三点:
- 并不是所有的 Term 都支持 Unicod 字符,比如 PostScript 不支持,pdf 和 png 后端 支持;
- 设置编码方式为
utf8,这一步并不是必需的,如果系统本身编码已经是utf8则不用重 新设置; - 设置支持 Unicod 的字体。
set term png
set encoding utf8
set title "振幅随时间的变化\n差值随时间的变化" font "Sarasa Term SC,18"

replot
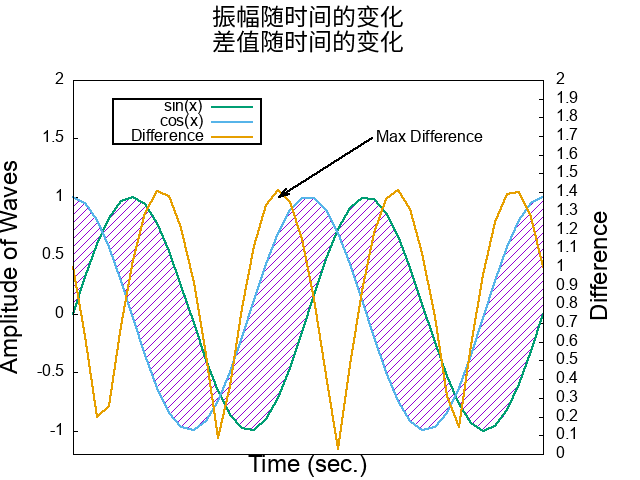
 本站文章如未特殊声明,默认采用