Gnuplot 绘图第五弹-多子图绘制
在本弹中,主要介绍关于在 Gnuplot 绘制多个子图的一些事。
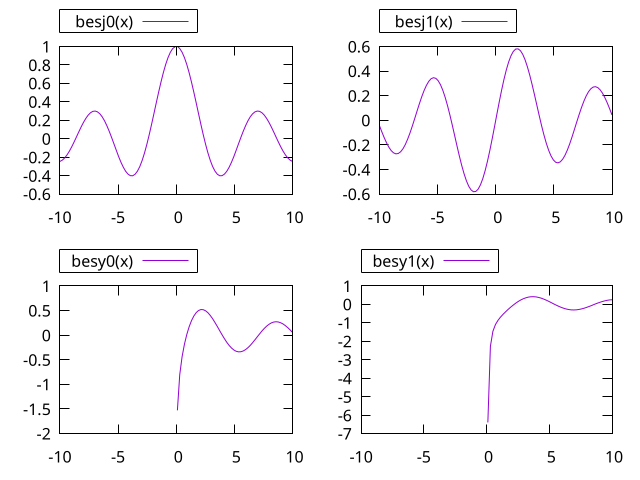
1. 安排子图阵列
set multiplot layout 2, 2
# 将 key 放在 top margin 中,并用 box 包裹起来
set key tmargin left box lt -1
plot besj0(x)
plot besj1(x)
plot besy0(x)
plot besy1(x)
unset multiplot

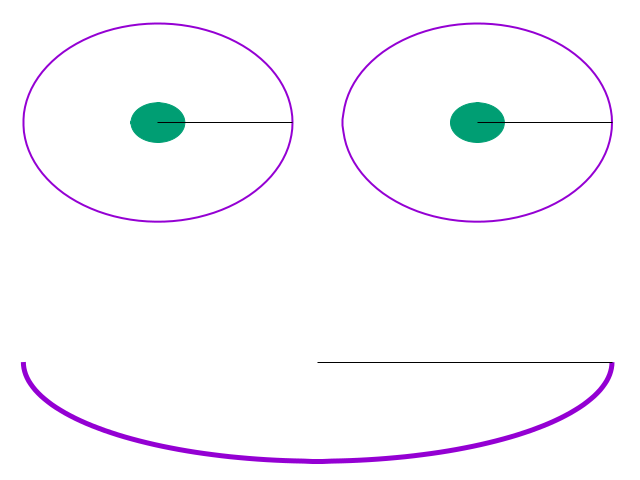
2. 手动摆放位置
set multiplot
unset key
unset tics
set polar
unset border

set size 1, .5
plot [pi:2*pi] 1 lw 5

set origin 0, .5
set size .5, .5
plot 1 lw 2, .2 with filledcurves

set origin .5, .5
set size .5, .5
plot 1 lw 2, .2 with filledcurves

unset multiplot

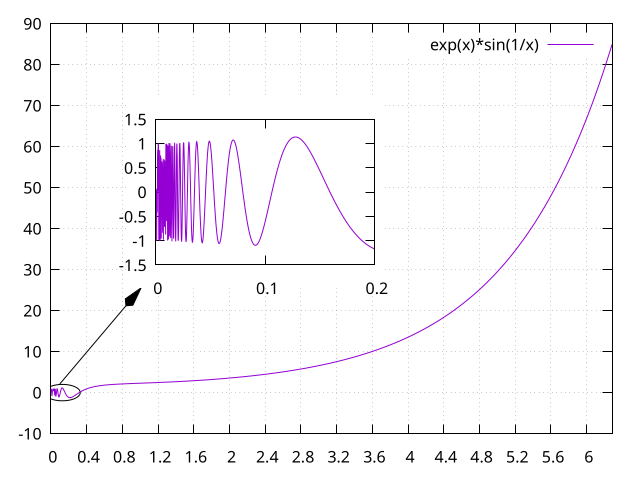
3. 内嵌子图
set multiplot
set object ellipse center .13, 0 size .4, 4
# 此处是一个非常好的利用多个坐标系进行定位的示例,arrow 默认的坐标系是第一坐标系,
# 也就是 axis 坐标系,screen 关键字是屏幕坐标系,是在屏幕上位置的百分比
set arrow from .1, 2.1 to screen .22, .4 front head filled size screen 0.03, 15, 135
set samples 1000
set grid
set xtics .4
set ytics 10
plot [0:2*pi] exp(x)*sin(1/x)

# reset 会将所有的设置重置,包括 samples 设置。此处也可以单独 unset arrow,
# object 等内容
reset
set origin .2, .4
set size .4, .4
# clear 用于清除新定义的子图区域内的内容,此处主要是为了清除网格线
clear
set sample 1000
set nokey
set xtics .1
set ytics .5
set bmargin 1
set tmargin 1
set lmargin 3
set rmargin 1
plot [0:.2] exp(x)*sin(1/x)
unset multiplot

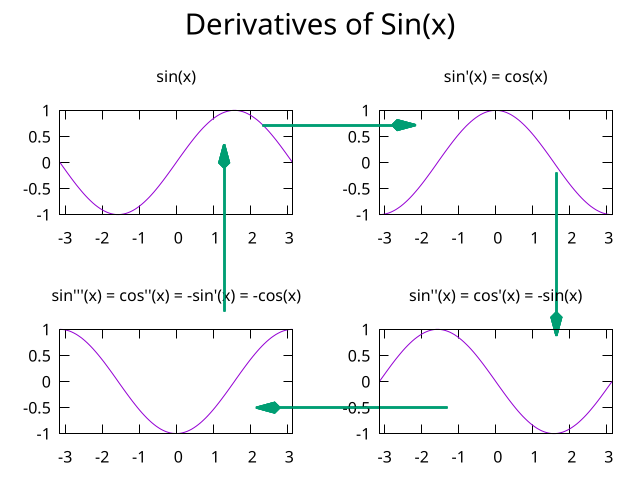
4. 多子图中的标签与箭头
set xrange [-pi:pi]
set ytics 0.5
unset key
set multiplot layout 2,2 title "Derivatives of Sin(x)" font ",22"
# size screen 后面的第一个数字是箭头的长度,15 是前面的角度,135 是后面的角度
set style arrow 1 head filled size screen 0.03,15,135 lt 2 lw 2
set arrow 1 from screen .41,.74 to screen .65,.74 arrowstyle 1
set arrow 2 from screen .87,.64 to screen .87,.3 arrowstyle 1
set arrow 3 from screen .7,.15 to screen .4,.15 arrowstyle 1
set arrow 4 from screen .35,.35 to screen .35,.7 arrowstyle 1

set title "sin(x)"
plot sin(x)
set title "sin\'(x) = cos(x)"
plot cos(x)
set title "sin\'\'\'(x) = cos\'\'(x) = -sin\'(x) = -cos(x)"
plot -cos(x)
set title "sin\'\'(x) = cos\'(x) = -sin(x)"
plot -sin(x)
unset multiplot

 本站文章如未特殊声明,默认采用