Gnuplot 绘图第四弹-调整刻度
现在,我们已经能够使用 Gnuplot 绘制出自己想要的图形,接下来在第四弹中,我们将对 刻度进行更细致的调整。
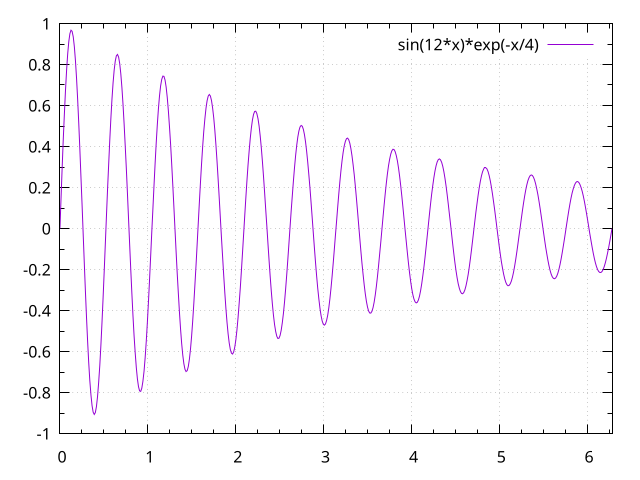
1. 启用副刻度
set sample 500
set grid
# x 轴每个主刻度拥有 4 个副刻度
set mxtics 4
# y 轴每个主刻度拥有 2 个副刻度
set mytics 2

plot [0:2*pi] sin(12*x)*exp(-x/4)
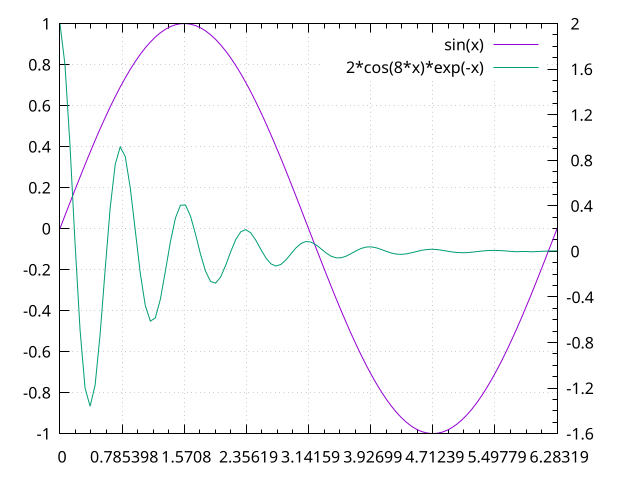
2. 第二坐标轴上的刻度
set ytics nomirror
# y2 主刻度的间距是 0.4
set y2tics 0.4
set my2tics 4
set xtics pi/4.
set mxtics 4
set grid

plot [0:2*pi] sin(x) axis x1y1, 2*cos(8*x)*exp(-x) axis x1y2
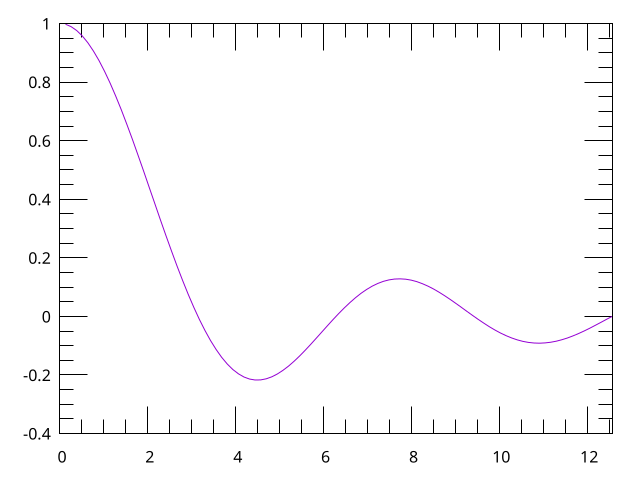
3. 调整刻度的长度
# 将主刻度的长度调整至默认值的 3 倍。如果没有特殊指定,副刻度的长度是主刻度的一
# 半,可通过 =set tics scale a, b 同时调整主副刻度的长度
set tics scale 3
set mxtics 4
set mytics 4

plot [0:4*pi] sin(x)/x notitle
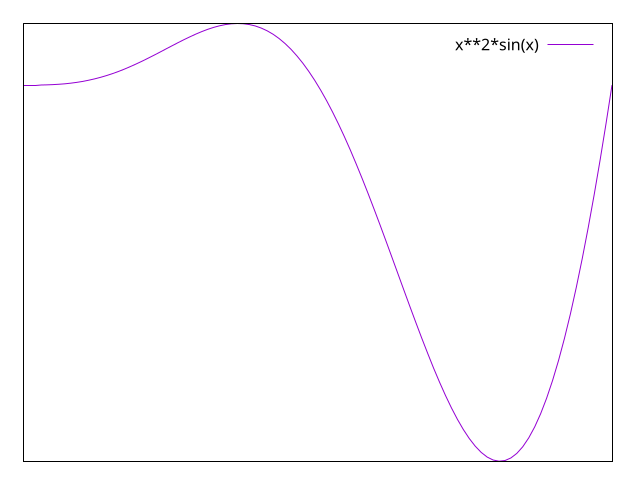
4. 移除所有的刻度
# Gnuplot 中有两种表达方式,=unset tics= 和 =set notics= 等价
# 同样地,=unset border= 也和 =set noborder= 等价
unset tics
plot [0:2*pi] x**2*sin(x)
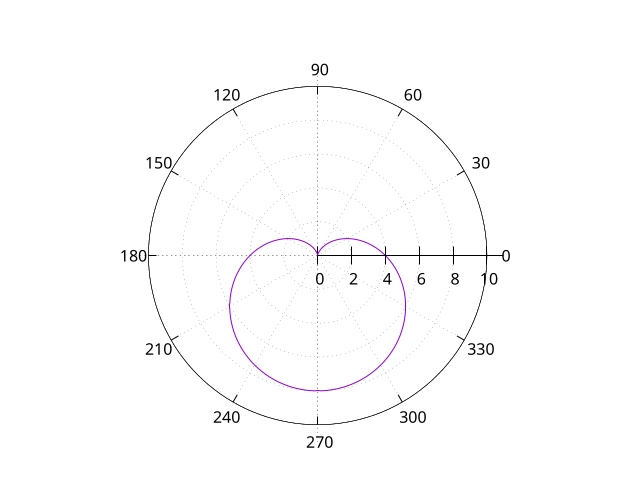
5. 精细调整刻度值
set size ratio 1
# 设置极坐标
set polar
# 按坐标系的位置设置坐标轴,并关闭副轴
set xtics axis nomirror
set ytics axis nomirror
set zeroaxis
unset border
set border polar
unset key
set samples 500
set grid
set rrange [0:11]
# 关闭笛卡尔坐标系下 x, y 轴刻度
unset xtics
unset ytics
# 设置极坐标系下的 r 和 t 轴,其中三个数字分别表示起始,间隔和终点
set rtics 0,2,10
set ttics 30

plot [0:2*pi] 4*(1-sin(t))
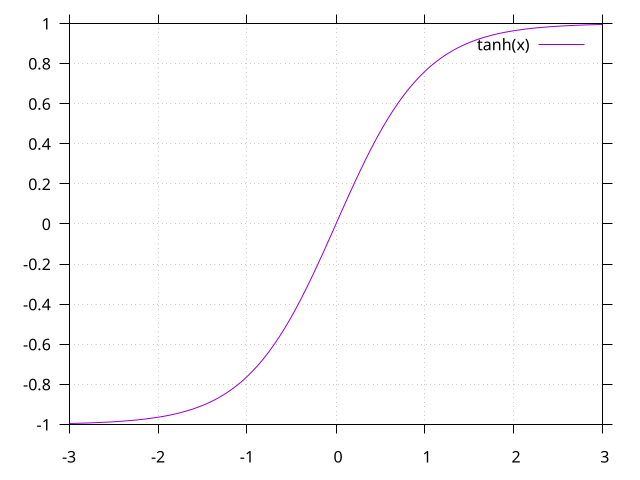
6. 刻度朝外
set tics out
set grid

plot [-3:3] tanh(x)
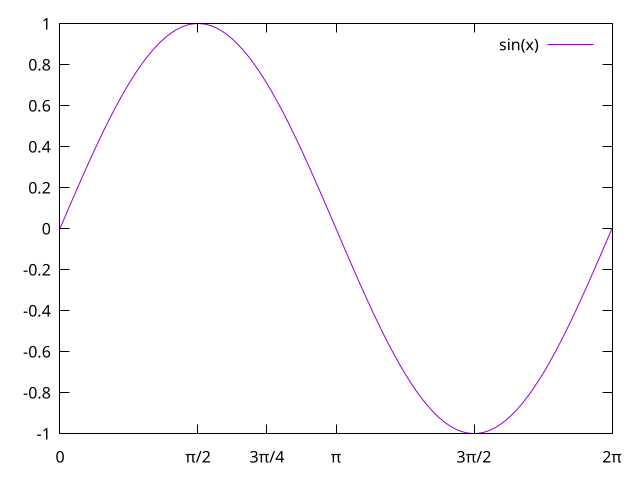
7. 手动设置刻度标签
set xtics ("{/Symbol p}" pi, "{/Symbol p}/2" pi/2,\
    "2{/Symbol p}" 2*pi, "3{/Symbol p}/2" 3*pi/2, "0" 0)
# add 关键字用于添加标签
set xtics add ("3{/Symbol p}/4" pi*3/4)

plot [0:2*pi] sin(x)
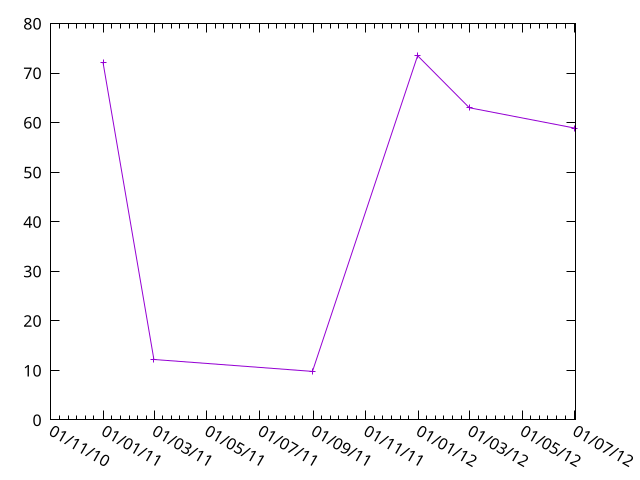
8. 时间和日期标签
| 1/1/2011 | 72.1 |
| 1/3/2011 | 12.2 |
| 1/9/2011 | 9.8 |
| 1/1/2012 | 73.5 |
| 1/3/2012 | 63 |
| 1/7/2012 | 58.9 |
# 告诉 Gnuplot x 轴的数据是时间
set xdata time
# 又什么格式解析数据中的时间
set timefmt "%d/%m/%Y %H:%M"
# x 轴标签的输出格式
set format x "%d/%m/%y"
# 旋转 xtics -30 度
set xtics rotate by -30
set rmargin 7

plot data using 1:2 with linespoints notitle
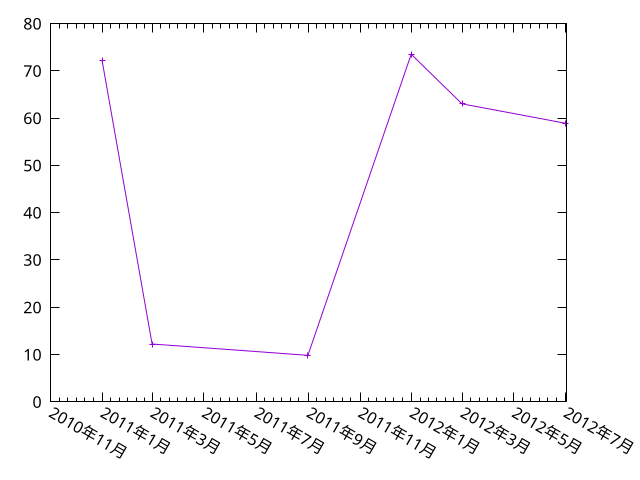
9. 在时间标签中启用地域设置
# 告诉 Gnuplot x 轴的数据是时间
set xdata time
# 启用地域设置
set locale "zh_CN.utf8"
# 又什么格式解析数据中的时间
set timefmt "%d/%m/%Y %H:%M"
# x 轴标签的输出格式
set format x "%Y年%b"
set xtics rotate by -30
set rmargin 8

plot data using 1:2 with linespoints notitle
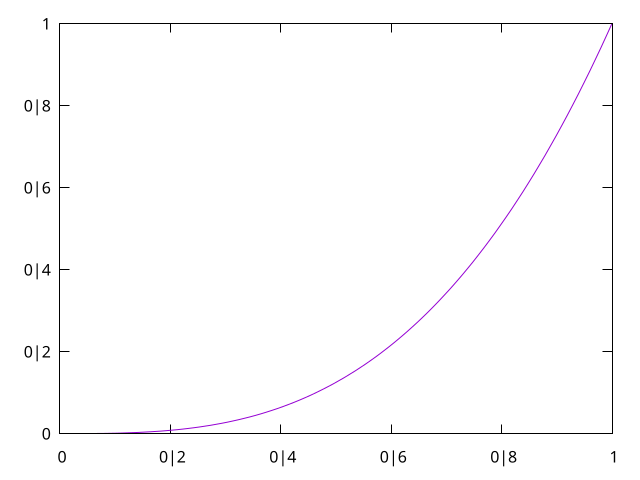
10. 设置不同地域的数字格式
此处本来应该用 set decimalsign locale "es_ES.utf8" 来做演示才能看出区别,但是不
知为什么我的电脑上好像只有 "en_US.utf8" 和 "zh_CN.utf8" 可用,可能是我在系统中只
开启了这两个编码。
set decimalsign locale "zh_CN.utf8"
# 手动设置数字分隔符
set decimalsign "|"
plot [0:1] x**3 notitle
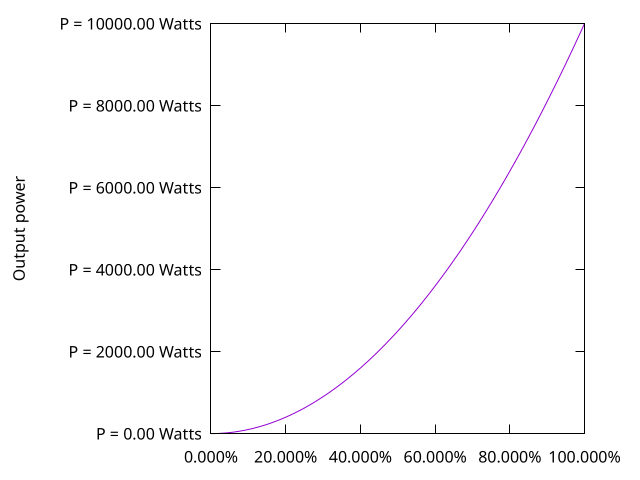
11. 格式化刻度标签
set ylabel "Output power"
set format y "P = %.2f Watts"
set format x "%.3f%%"
# Axes 的右侧与 Canvas 的右侧间距 6 个字符宽度,防止最后一个标签跑到外面去
set rmargin 6

plot [0:100] x**2 notitle
这里有个小技巧,我们可以通过 format 的方式隐藏所有的标签
set format y ""
set format x ""
unset key
set grid

plot x, -x